Valgrind output explained: Invalid read, definitely lost
Invalid read of size 4, uninitialised value, definitely lost, still reachable: each Valgrind message explained on a buggy program, and how to fix it.
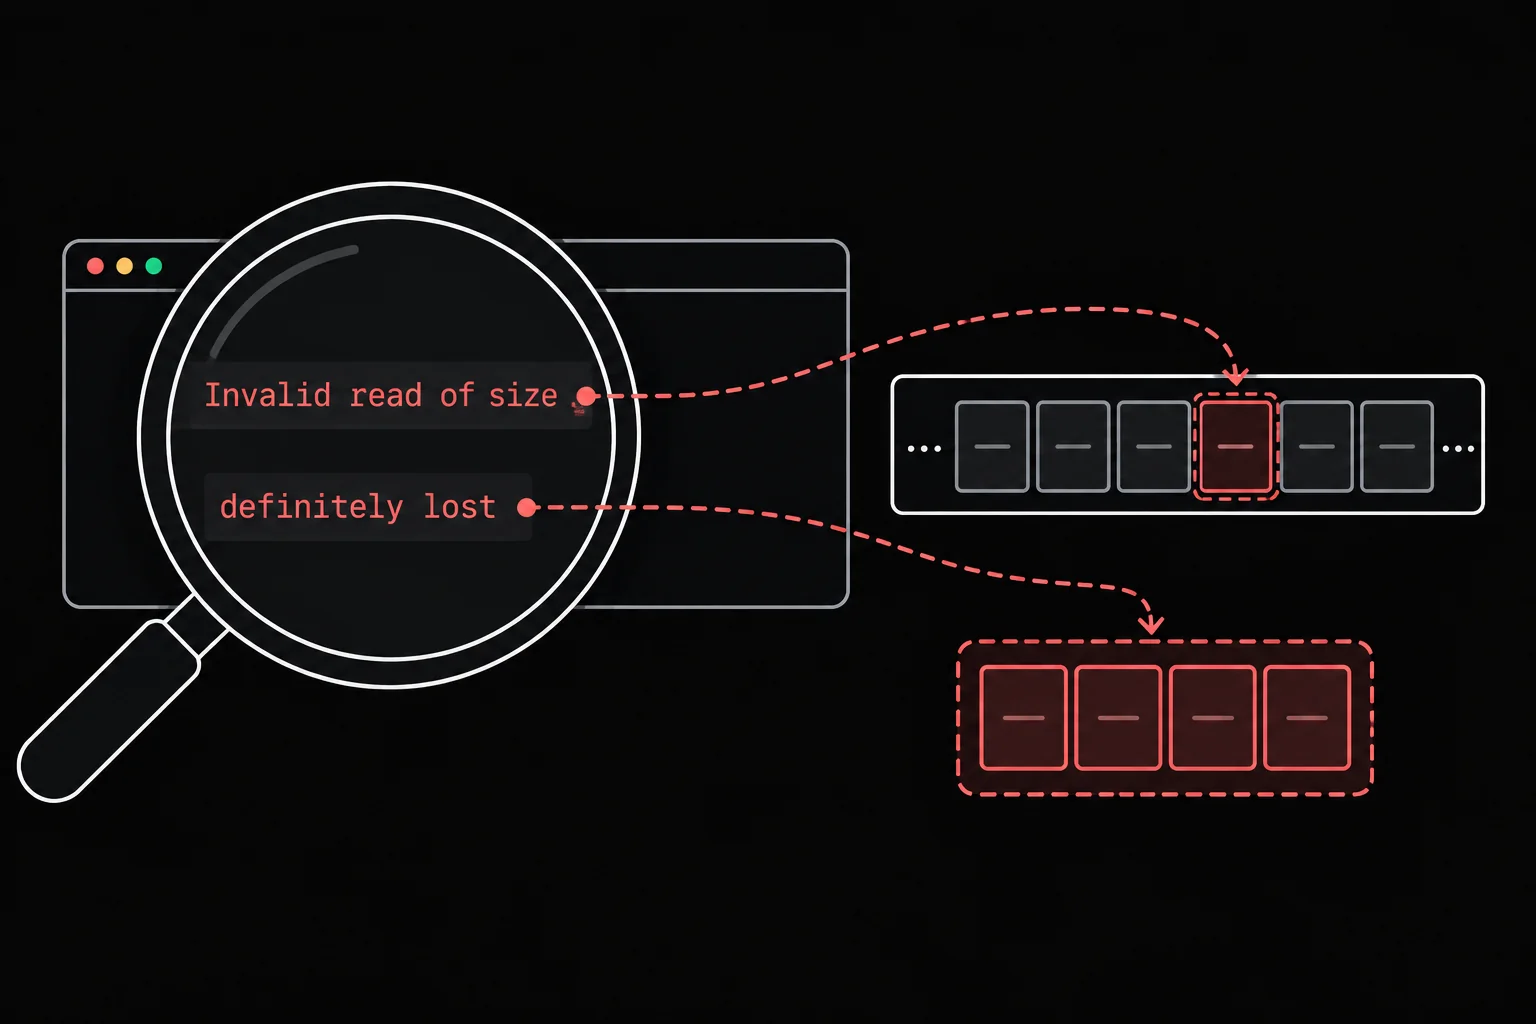
Valgrind finds the memory bugs the compiler can't see: out-of-bounds reads, values that were never initialized, blocks that were never freed. You still have to decode its report, a pile of hex addresses and terse jargon. Every message follows a fixed structure, though, and once you know it, you can trace an error back to the faulty line in seconds.
In short
Read a Valgrind report from the top down: the first line names the kind of error (Invalid read of size 4, definitely lost...), the at and by lines give the call stack, and you look for the first one that points into your own file. Compile with -g to get line numbers, and run valgrind --leak-check=full --track-origins=yes ./prog. The last line, ERROR SUMMARY, counts the errors. Each family of messages has a specific cause and a simple fix, detailed below.
The shape of a message
Take this program, which allocates five integers and reads a sixth:
#include <stdio.h>#include <stdlib.h>
int main(void){ int *scores = malloc(5 * sizeof(int)); if (scores == NULL) return 1; for (int i = 0; i <= 5; i++) scores[i] = 10 + i; printf("last score: %d\n", scores[5]); free(scores); return 0;}$ gcc -Wall -Wextra -g scores.c -o scores$ valgrind --leak-check=full --track-origins=yes ./scores==13== Memcheck, a memory error detector==13== Copyright (C) 2002-2024, and GNU GPL'd, by Julian Seward et al.==13== Using Valgrind-3.24.0 and LibVEX; rerun with -h for copyright info==13== Command: ./scores==13== ==13== Invalid write of size 4==13== at 0x40070C: main (scores.c:10)==13== Address 0x4a7f054 is 0 bytes after a block of size 20 alloc'd==13== at 0x488545C: malloc (vg_replace_malloc.c:446)==13== by 0x4006D3: main (scores.c:6)==13== ==13== Invalid read of size 4==13== at 0x400730: main (scores.c:11)==13== Address 0x4a7f054 is 0 bytes after a block of size 20 alloc'd==13== at 0x488545C: malloc (vg_replace_malloc.c:446)==13== by 0x4006D3: main (scores.c:6)==13== last score: 15...==13== ERROR SUMMARY: 2 errors from 2 contexts (suppressed: 0 from 0)Every piece has a job. The ==13== at the start of each line is the process ID: just a prefix that keeps Valgrind's commentary apart from your program's own output. The first line of a block gives the kind of error. The at line is the exact location of the bad access, and the by lines are its callers. Here, main (scores.c:10) and main (scores.c:11): your loop writes, then reads, one element too many.
The next line explains the address: 0 bytes after a block of size 20 alloc'd. The block is 20 bytes (five ints), and the access lands right after it. The second at/by group tells you where that block was allocated: scores.c:6. The fix is in the loop condition, i < 5 instead of i <= 5.
Invalid read / write of size N
That's the message from the program above. Invalid means the access falls outside any valid block, read or write tells you which one you did, and size N gives the size of the access in bytes (4 for an int). The line about the address says where it landed, relative to the nearest block:
0 bytes after a block of size 20: right past the end, an overrun off the top;is 2 bytes inside a block of size 32 free'd: inside a block that was already freed, so an access afterfree;is not stack'd, malloc'd or (recently) free'd: an address that matches nothing Valgrind knows about, often a null or garbage pointer.
The cause always belongs to the same family: an index out of bounds, a miscomputed pointer, or a block used after it was given back. Valgrind reports the access but doesn't stop it, so a crash can follow right after the message. Memcheck only sees these overruns on the heap: running off the end of a local array won't give you an Invalid read.
Conditional jump or move depends on uninitialised value(s)
This one catches people off guard, because the program compiles and often prints a result that looks right. It shows up when a decision in your program depends on a value that was never initialized:
#include <stdio.h>
static int sum(const int *t, int n){    int total;
    for (int i = 0; i < n; i++)        total += t[i];    return total;}
int main(void){    int scores[3] = {12, 15, 9};
if (sum(scores, 3) >= 30) printf("pass\n"); else printf("fail\n"); return 0;}$ gcc -Wall -Wextra -g sum.c -o sum$ valgrind -q --track-origins=yes ./sum==21== Conditional jump or move depends on uninitialised value(s)==21== at 0x4006D4: main (sum.c:16)==21== Uninitialised value was created by a stack allocation==21== at 0x400644: sum (sum.c:4)==21== passtotal never got a starting value, so total += t[i] adds onto whatever was there. Valgrind doesn't complain when you copy an uninitialised value, only when it affects what the program does: a decision, like the if on line 16, a computed address, or a system call. That's what --track-origins=yes is for: the second half of the message traces the value back to where it came from, a stack allocation in sum at line 4. The option doubles the run time and adds at least 100 MB of memory, but on this kind of bug it saves you a lot of time. The fix: int total = 0;.
The message depends on how the value is used, not on where it came from: Use of uninitialised value of size N appears when the value serves as an address or an index (often inside printf, which converts the number to text). If the value comes from malloc, the origin reads a heap allocation instead of a stack allocation. The remedy is the same: initialize before reading, or allocate with calloc(3), which zeroes everything.
Invalid free
Valgrind tracks every block on the heap, so it knows when a free is invalid:
$ valgrind -q ./doublegrademe==29== Invalid free() / delete / delete[] / realloc()==29== at 0x48884F8: free (vg_replace_malloc.c:989)==29== by 0x40071B: main (double.c:13)==29== Address 0x4a7f040 is 0 bytes inside a block of size 16 free'd==29== at 0x48884F8: free (vg_replace_malloc.c:989)==29== by 0x400713: main (double.c:12)==29== Block was alloc'd at==29== at 0x488545C: malloc (vg_replace_malloc.c:446)==29== by 0x4006D3: main (double.c:7)==29== Three key moments in a single block: the bad free (line 13), the earlier free of the same block (line 12), and the original allocation (line 7). That's a double free. glibc's own messages for these cases (double free detected in tcache 2, invalid pointer) and how to fix them have their own article, double free detected.
Leaks: definitely, indirectly, possibly, still reachable
When the program exits, Valgrind lists the memory that is still allocated and sorts it into four categories. This program produces one of each:
#include <stdlib.h>
struct node {    int value;    struct node *next;};
char *cursor;char *log_buffer;
int main(void){    char *copy = malloc(32);    /* lost: pointer overwritten */    copy = NULL;
    struct node *head = malloc(sizeof(struct node));    head->next = malloc(sizeof(struct node));   /* held by head */    head = NULL;                /* the whole list becomes unreachable */
    cursor = malloc(64);    cursor += 10;               /* only a pointer into the block remains */
log_buffer = malloc(128); /* never freed, but still pointed to */ return 0;}$ valgrind --leak-check=full --show-leak-kinds=all ./leaks...==37== 16 bytes in 1 blocks are indirectly lost in loss record 1 of 5==37== at 0x488545C: malloc (vg_replace_malloc.c:446)==37== by 0x40066F: main (leaks.c:17)==37== ==37== 32 bytes in 1 blocks are definitely lost in loss record 2 of 5==37== at 0x488545C: malloc (vg_replace_malloc.c:446)==37== by 0x400653: main (leaks.c:13)==37== ==37== 32 (16 direct, 16 indirect) bytes in 1 blocks are definitely lost in loss record 3 of 5==37== at 0x488545C: malloc (vg_replace_malloc.c:446)==37== by 0x400663: main (leaks.c:16)==37== ==37== 64 bytes in 1 blocks are possibly lost in loss record 4 of 5==37== at 0x488545C: malloc (vg_replace_malloc.c:446)==37== by 0x400687: main (leaks.c:20)==37== ==37== 128 bytes in 1 blocks are still reachable in loss record 5 of 5==37== at 0x488545C: malloc (vg_replace_malloc.c:446)==37== by 0x4006BB: main (leaks.c:23)==37== ==37== LEAK SUMMARY:==37== definitely lost: 48 bytes in 2 blocks==37== indirectly lost: 16 bytes in 1 blocks==37== possibly lost: 64 bytes in 1 blocks==37== still reachable: 128 bytes in 1 blocksEach category describes a different relationship between your program and the forgotten block:
| Category | What it means |
|---|---|
definitely lost | no pointer refers to the block anymore. A plain leak: fix it. |
indirectly lost | the block is lost only because the block that pointed to it is lost too (a node of a list whose head leaked). |
possibly lost | a pointer remains, but it points into the middle of the block, not to its start. Valgrind can't swear it's a real reference. |
still reachable | the block is still pointed to at exit (often by a global). You could have freed it, and you didn't. |
With --leak-check=full, Valgrind only details definitely and possibly (the default for --show-leak-kinds is definite,possible). Add --show-leak-kinds=all to see indirectly and still reachable as well. In this program, freeing the list properly from head makes the direct loss and the indirect loss disappear in one go: fix the root, not each node.
ERROR SUMMARY: errors and contexts
The last line does the counting. Run a program that reads three elements past the end of an array allocated on the heap, inside a loop:
$ valgrind ./loop 2>&1 | tail -1==45== ERROR SUMMARY: 3 errors from 1 contexts (suppressed: 0 from 0)3 errors from 1 contexts: the same bad read happened three times (three iterations of the loop), but from a single place in the code. Valgrind groups identical errors by "context", meaning by call stack, so a bug inside a loop doesn't drown the report. Always aim for zero, and work through the contexts one by one. suppressed counts known errors you chose to ignore through a suppression file; it's zero here.

read_the_leak
build_path returns the right path but loses a block on every call. The printed text is correct; it's the memory check that fails. The exercise puts you exactly where a definitely lost needs to be read and fixed. Some Grademe C exercises add this memory check with Memcheck, and the smallest leak turns the memory cell red even when the output is right.
The command and its options are summed up in the valgrind(1) entry.
Frequently asked questions
What does "Invalid read of size 4" mean?
Your program read 4 bytes (the size of an int) at an address outside any valid block. The next line says relative to which block: 0 bytes after a block of size 20 is an overrun just past the end of an array of five ints. The usual cause is an out-of-bounds index.
Why "conditional jump depends on uninitialised value" when my code works?
Because a variable feeds a decision without ever getting a starting value. The "correct" result is luck, based on whatever was in memory that day. Initialize the variable, or allocate with calloc. Add --track-origins=yes to see where the value comes from.
What's the difference between "definitely lost" and "still reachable"?
definitely lost means no pointer refers to the block anymore: you can't even free it, it's a real leak. still reachable means the block is still pointed to when the program ends, often by a global: you could have freed it. Both point to a missing free.
Do I need to fix "still reachable" blocks?
In a program that exits, the operating system reclaims all of its memory, so still reachable is less serious than a real leak. In a service that runs for a long time, though, those blocks pile up. In the C exercises that check memory, Grademe's grader counts them as errors: aim for a run with no blocks left at all.
What do "errors" and "contexts" count?
errors is the total number of errors encountered, contexts the number of distinct places in the code they come from. An error inside a loop counts several times, but from a single context. Fix one context at a time.
Sources