Segmentation fault in C: causes and how to find the line
Your C program stops on "Segmentation fault" and says nothing else? The most common causes, and how to find the exact line with gdb or Valgrind.
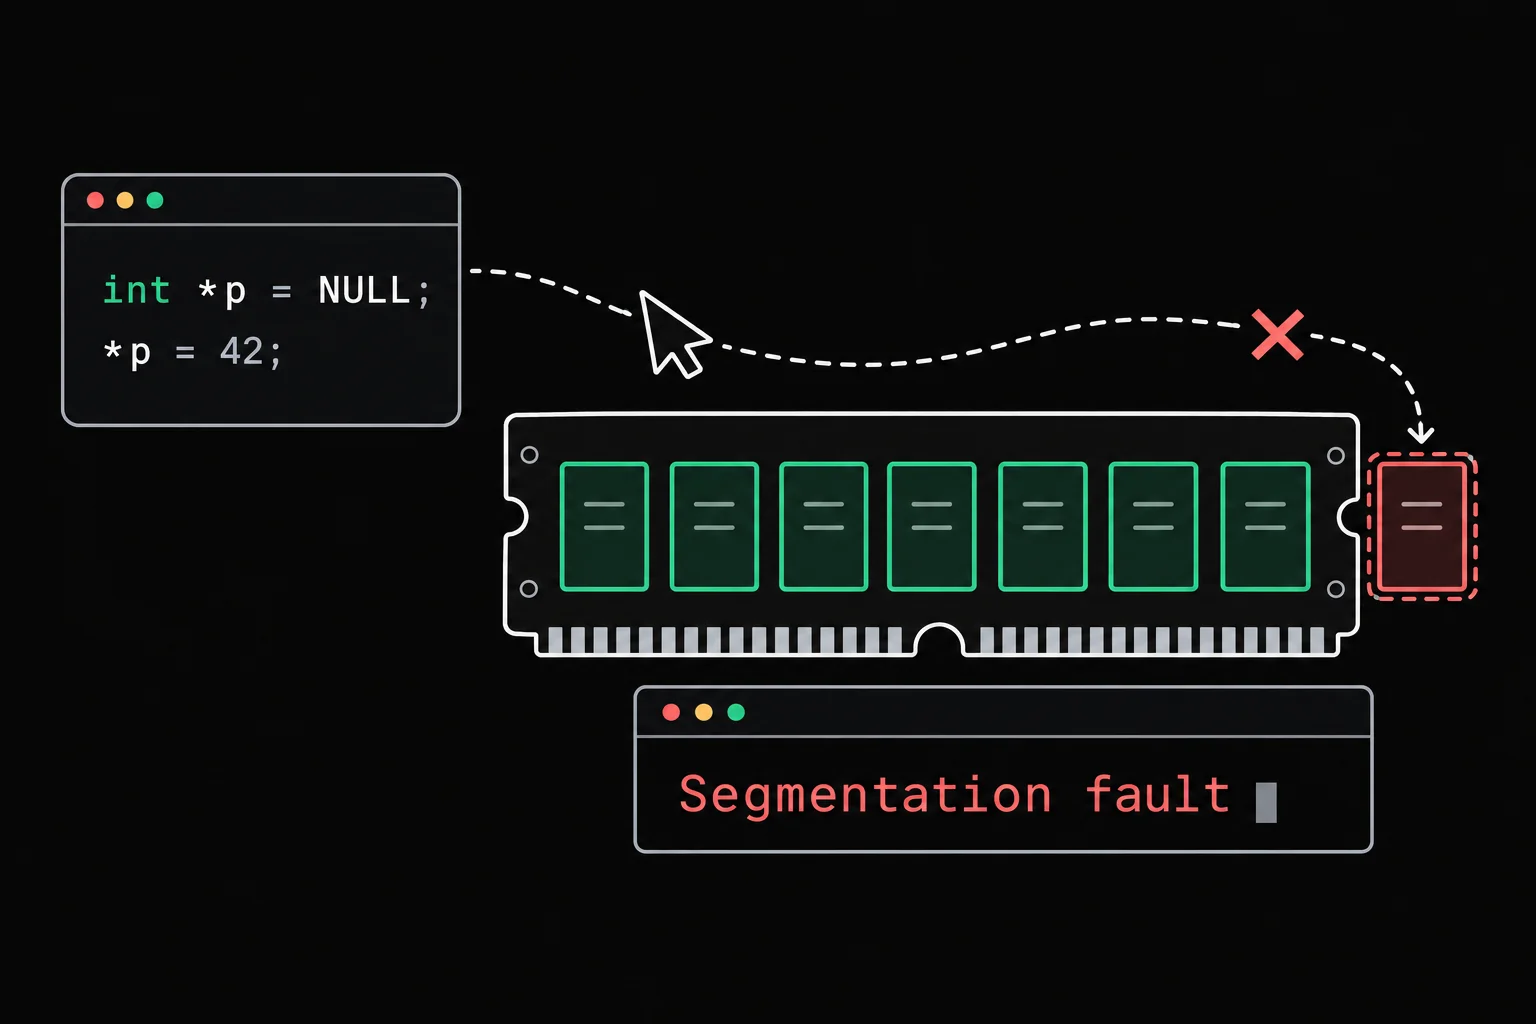
The program compiles without a single error. You run it, it prints a line or two, then stops dead on Segmentation fault. No line number, no variable name. The good news: one command takes you to the faulty line, and the cause is almost always on a short list.
In short
A segmentation fault is the operating system stopping your program because it touched a memory address it does not own: a NULL pointer, a read-only string, memory already given back, an exhausted stack. The compiler cannot always see it coming. To find the line, recompile with -g, then run gdb -q -batch -ex run -ex bt ./main or valgrind ./main: both print the file and line number where the program crashed.
What does "Segmentation fault" mean?
It is the name of the SIGSEGV signal, which the kernel sends to a process that reads or writes at a forbidden address. Every program has its own address space, split into regions: code, data, heap, stack. An address outside those regions, or a write into a read-only one, raises the signal, and the program stops on the spot.
Take this program, which reads an integer through a pointer that points to nothing:
#include <stdio.h>
int main(void){    int *score = NULL;
printf("Reading the score...\n"); printf("%d\n", *score); return 0;}$ gcc -Wall -Wextra -g null.c -o null$ ./nullReading the score...Segmentation fault$ echo $?139Exit code 139 is 128 + 11, and 11 is the number of SIGSEGV on Linux. On many machines the message ends with (core dumped). Whether it does depends only on the size limit for core files:
$ ulimit -c unlimited$ ./nullReading the score...Segmentation fault (core dumped)The system wrote an image of the process memory at the moment of the crash into a core file, which a debugger can load afterwards. The crash itself is exactly the same.
Find the exact line with one command
The method takes three steps, and it works for every case below.
Recompile with
-g. The binary then keeps the mapping between machine instructions and the lines of your source file.Run the program again inside gdb(1) or under valgrind(1).
Read the first line that points into your own file. The lines above it often belong to the C library, and that is not where the bug is.
With gdb, non-interactively:
$ gdb -q -batch -ex run -ex bt ./nullReading the score...
Program received signal SIGSEGV, Segmentation fault.0x00000000004006a0 in main () at null.c:88	    printf("%d\n", *score);#0  0x00000000004006a0 in main () at null.c:8
-ex run starts the program, -ex bt prints the call stack (the backtrace) at the moment of the crash. The answer is on the second line: null.c:8, and gdb even prints the faulty line for you.
Valgrind gives the same line, and tells you what kind of access it was:
$ valgrind -q ./nullReading the score...==8== Invalid read of size 4==8== at 0x4006A0: main (null.c:8)==8== Address 0x0 is not stack'd, malloc'd or (recently) free'd==8== ==8== ==8== Process terminating with default action of signal 11 (SIGSEGV)==8== Access not within mapped region at address 0x0==8== at 0x4006A0: main (null.c:8)...Segmentation faultInvalid read of size 4: the program tried to read 4 bytes, the size of an int. Address 0x0: at address zero, in other words NULL. When the address is 0x0 or a very small value, look for a null pointer. How to read a Valgrind report goes through each message.
The most common causes
These are the five you run into most often when writing C. Every program below was compiled with -Wall -Wextra: count how many of them came with a warning.
Dereferencing a NULL pointer
That is what null.c does. A pointer is NULL because you initialized it that way, because a function failed (malloc returns NULL when memory runs out, fopen when the file does not exist), or because you forgot to point it somewhere.
Stack
- int *score
- NULL
The pointer exists, but it designates no int. Writing *score asks for the integer stored at address zero, which the system reserves precisely so that this kind of access crashes immediately. The habit to build: whenever a pointer comes from a function that can fail, test it before you use it.
Forgetting the & in scanf
scanf(3) needs to know where to store the value it reads, so it expects an address. Pass it the variable itself and you hand it some arbitrary value that it will treat as an address.
#include <stdio.h>
int main(void){    int age;
printf("Your age: "); scanf("%d", age); printf("You are %d years old\n", age); return 0;}$ gcc -Wall -Wextra -g scanf.c -o scanfscanf.c: In function 'main':scanf.c:8:13: warning: format '%d' expects argument of type 'int *', but argument 2 has type 'int' [-Wformat=] 8 | scanf("%d", age); | ~^ ~~~ | | | | | int | int *scanf.c:8:5: warning: 'age' is used uninitialized [-Wuninitialized] 8 | scanf("%d", age); | ^~~~~~~~~~~~~~~~scanf.c:5:9: note: 'age' was declared here 5 | int age; | ^~~$ echo 19 | ./scanfSegmentation faultGCC said so twice before the program even ran: expects argument of type 'int *'. The fix is scanf("%d", &age);.
Notice one detail: "Your age: " never appeared, even though that printf runs before the crash. The text was waiting in an output buffer that never got flushed. That trap deserves its own article: why printf prints nothing before a crash.
Modifying a string literal
#include <stdio.h>
int main(void){    char *name = "grademe";
name[0] = 'G'; printf("%s\n", name); return 0;}$ gcc -Wall -Wextra -g literal.c -o literal$ ./literalSegmentation faultThis time, no warning at all. The text "grademe" is a string literal: the compiler stores it in a read-only region of the program, and name only points to it. The standard says that modifying it is undefined behavior; on Linux, that turns into a segfault.
Stack
- char *name
- literal
Static data
To get a string you can modify, declare an array: it receives its own copy of the text, on the stack.
char *name = "grademe";name[0] = 'G'; /* writes to read-only memory */char name[] = "grademe";name[0] = 'G'; /* name is your own copy */The full difference between the two declarations is in Array vs pointer in C.
Returning the address of a local variable
#include <stdio.h>#include <stdlib.h>#include <string.h>
char *copy(const char *source){    char buffer[32];
    strcpy(buffer, source);    return buffer;}
int main(void){    char *s = copy("hello");
printf("%s\n", s); return 0;}$ gcc -Wall -Wextra -g dangling.c -o danglingdangling.c: In function 'copy':dangling.c:10:12: warning: function returns address of local variable [-Wreturn-local-addr] 10 | return buffer; | ^~~~~~$ ./danglingSegmentation faultbuffer lives in the stack frame of copy, which disappears at the return. The returned address no longer designates anything valid. The gdb backtrace reveals an instructive detail:
$ gdb -q -batch -ex run -ex bt ./dangling
Program received signal SIGSEGV, Segmentation fault.__strlen_generic () at ../sysdeps/aarch64/multiarch/../strlen.S:54#0  __strlen_generic () at ../sysdeps/aarch64/multiarch/../strlen.S:54#1  0x0000ffff971d1ce8 in __GI__IO_puts (str=0x0) at ./libio/ioputs.c:35#2  0x00000000004006c8 [PAC] in main () at dangling.c:17
Two things to read here. First, the crash happens inside strlen, a C library function: you have to go down to line #2 to find your own code, dangling.c:17. Second, str=0x0: GCC detected that the function returned the address of a local variable and replaced it with NULL, and it turned printf("%s\n", s) into a faster puts(s). Another compiler could have returned the old address and printed garbage. Either way, the fix is to allocate the result with malloc and let the caller free it.
Recursion that never stops
#include <stdio.h>
int count(int n){    return count(n + 1) + 1;}
int main(void){ printf("%d\n", count(0)); return 0;}$ gcc -Wall -Wextra -g recursion.c -o recursionrecursion.c: In function 'count':recursion.c:3:5: warning: infinite recursion detected [-Winfinite-recursion] 3 | int count(int n) | ^~~~~recursion.c:5:12: note: recursive call 5 | return count(n + 1) + 1; | ^~~~~~~~~~~~$ ./recursionSegmentation faultEach call pushes a new frame. Without a base case, the stack grows until it hits its limit (ulimit -s prints 8192, that is 8 MB, on most Linux distributions) and the first access past it raises the signal. Here, GCC spotted the infinite recursion. It will not always see it, for instance when the base case exists but is never reached.
No segfault does not mean no bug
The most treacherous case does not crash at all. This program reads one slot past the end of an array of five scores:
#include <stdio.h>
int main(void){    int scores[5] = {12, 15, 9, 18, 11};
for (int i = 0; i <= 5; i++) printf("scores[%d] = %d\n", i, scores[i]); return 0;}$ gcc -Wall -Wextra -g bounds.c -o bounds$ ./boundsscores[0] = 12scores[1] = 15scores[2] = 9scores[3] = 18scores[4] = 11scores[5] = 5No warning, no crash, and a sixth score that does not exist. scores[5] sits right after the array, in memory that still belongs to the program: the system has no reason to step in, and you simply read whatever happens to be there. A segfault only happens when the address leaves the process's regions, and an overflow of a few bytes almost never does.
To catch this kind of error, you need a tool that checks every access. AddressSanitizer, built into GCC and Clang, is turned on at compile time:
$ gcc -g -fsanitize=address bounds.c -o bounds-asan$ ./bounds-asanscores[0] = 12scores[1] = 15scores[2] = 9scores[3] = 18scores[4] = 11===================================================================13==ERROR: AddressSanitizer: stack-buffer-overflow on address 0xfbff9b600034 at pc 0x000000400b94 bp 0xffffd87caea0 sp 0xffffd87caeb8READ of size 4 at 0xfbff9b600034 thread T0 #0 0x000000400b90 in main /home/student/lab/bounds.c:8... This frame has 1 object(s): [32, 52) 'scores' (line 5) <== Memory access at offset 52 overflows this variable...SUMMARY: AddressSanitizer: stack-buffer-overflow /home/student/lab/bounds.c:8 in mainThe report names the variable (scores), its extent (bytes 32 to 52, so 20 bytes for 5 ints) and the faulty access right after it. This is why memory bugs in C are so hard: the same program can seem to work on your machine and crash on another. Undefined behavior in C covers this in depth.

index_guard
The starter program reads a[i] before checking that i is a valid index. Most tests pass, then a single one crashes the process. Put the two statements back in the right order.
Habits that prevent most segfaults
Of the five crashes above, three were announced by GCC before the first run. So the first habit is to compile with -Wall -Wextra and read every warning as a probable bug. The others:
initialize every pointer, to
NULLif it has no target yet, and test it before dereferencing it when it comes frommalloc,fopenor any function that can fail;after
free(p), writep = NULL;: a second access will crash loudly instead of reading recycled memory;never return the address of a local variable; allocate the result, or have the caller pass in a buffer;
while you develop, compile now and then with
-fsanitize=addressor run your tests under Valgrind.
dangling_repair
build_label returns a string built in memory that no longer exists by the time the caller reads it. The text tests pass, the memory check fails: fix the function so it returns a block it actually owns.
Frequently asked questions
What does "core dumped" mean?
The system wrote an image of the process memory at the moment of the crash to disk, in a "core" file. A debugger can open it afterwards (gdb ./main core) to inspect the program's state. The mention only appears if core dumps are enabled on your machine; without it, the crash is the same.
Why does my program crash on one machine and not on another?
Because an invalid memory access is undefined behavior: the result depends on what sits at that address, on the compiler, on the optimization flags and on the system. A program with an array overflow that "works on my machine" can crash elsewhere. The absence of a crash proves nothing; you need a tool like Valgrind or AddressSanitizer.
Can a segfault damage my computer?
No. The segfault is the operating system protecting the memory of other programs by stopping yours. Nothing gets written outside your process's address space.
Why doesn't the printf right before the crash show up?
Because standard output is buffered. When it is not connected to a terminal, or when the line does not end with \n, the text waits in the buffer and disappears with the process. fflush(stdout) forces it out. The details are in printf prints nothing before a crash.
Sources